I released the JUnzip library back in 2014 as a minimalistic C library for reading ZIP files without heavy dependencies. It worked well for simple cases, but had a long-standing limitation: it couldn't handle "streaming" ZIP files where file sizes weren't known upfront. These ZIPs set bit 3 in the general purpose flag and store sizes in a "data descriptor" after the file data instead of the header. I was not aware of this exact nature of the problem until last week, just that many zips, annoyingly those including Google Photos generated ones, just failed when I tried to view them with JZipView that uses my JUnzip library as well.
Fast forward to December 2025, and with help from ChatGPT 5.2 and OpenAI Codex, I finally fixed this issue. It feels great to breathe new life into a project that's been dormant for so long!
What Changed in JUnzip
The core fix was improving support for ZIP data descriptors. When a ZIP entry has bit 3 set in generalPurposeBitFlag, the local file header contains zeros for CRC, compressed size, and uncompressed size. The actual values come in a data descriptor that follows the file data. My library was assuming both local headers and end file data contain all needed data, and thus failed when encountering these zips.
The key changes:
A new jzReadDataDescriptor() function that reads the optional descriptor (handling both signature-present and signature-absent variants)
Modified jzReadLocalFileHeader() to preserve sizes from the central directory when the local header has zeros
Updated jzReadData() to automatically consume the data descriptor when present
This was an API-breaking change — the callback signature for jzReadCentralDirectory() now includes a void *user_data parameter. Additionally, the library uses a JZFile abstraction instead of raw FILE* pointers.
Simon Willison is writing great coverage on LLM, and his little web toolbox at
https://tools.simonwillison.net/ got me inspired — use Github Pages to make any file in a tools repository automatically available.
So of course I wanted one too: tools.codeandlife.com.
I created https://github.com/jokkebk/tools, enabled GitHub Pages for it, and set a
custom domain tools.codeandlife.com in the repo settings. GitHub does the rest: deploy on push, serve
static HTML. This should be plenty for one page HTML utils.
The DNS part (OpalStack edition)
The plan was the usual:
Make a CNAME record for tools pointing to jokkebk.github.io
Wait for DNS to propagate
...
Profit!
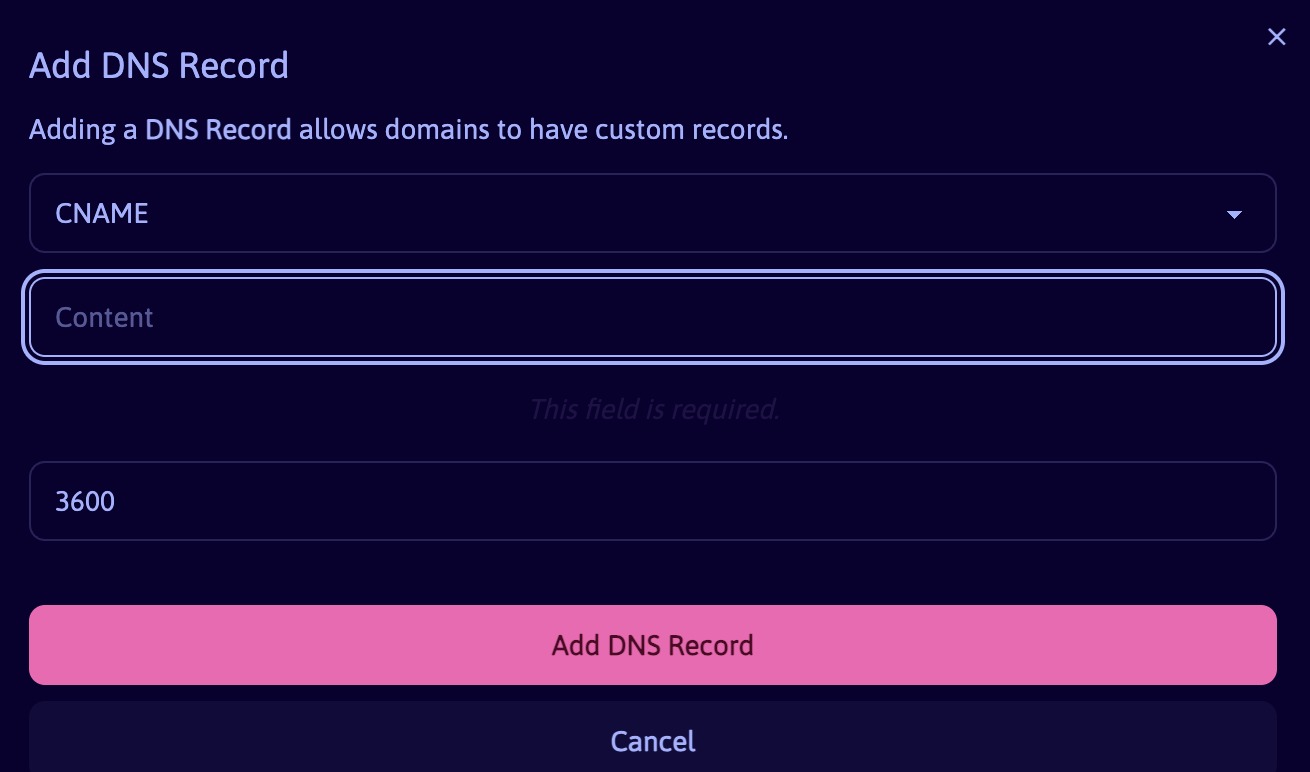
But I got stuck in a surprisingly silly place: Opalstack allowed me to "Add DNS Record" for my codeandlife.com domain, but it only had one field and TTL (time-to-live) setting, not two:
I tried to enter "tools CNAME jokkebk.github.io" as well as "tools jokkebk.github.io" to it, but it did not work. Turns out the correct approach was against what ChatGPT instructed:
Create the tools subdomain in OpalStack control panel first
Then add the custom DNS record for it: CNAME jokkebk.github.io
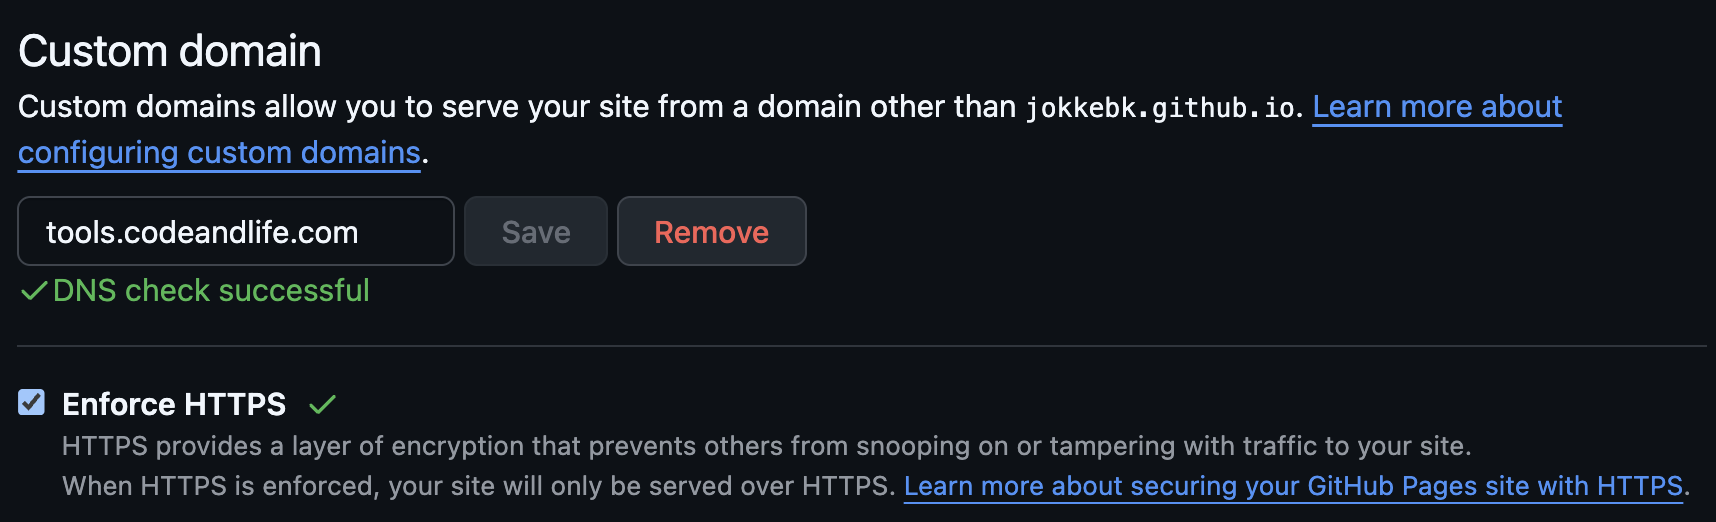
Running dig tools.codeandlife.com confirmed all was working. Committing a test.html resulted in an error page, but after I tried a minute later, it worked! GitHub Pages has happily accepted tools.codeandlife.com as the custom domain, and only thing remaining is to actually create some tools there. :)
Note: Actually, looks like I needed also to wait for Github to DNS check my domain (took about 15 minutes) and then issue a certificate for it (another 5-10 minutes) so I got https://tools.codeandlife.com/ working. I checked "Enforce HTTPS" so now I should be good to go!
After about 6 years in hiatus, AI vibe coding finally enabled me to update
my JavaScript-based Go board rendering library, jGoBoard. We've (meaning Claude Code and I) just rolled out version 4.0.3, and it brings a modern build stack and a bugfix to boot.
Also thanks to Gemini CLI which composed the structure of this post, although the signature AI fluff needed to be heavily edited afterwards.
For those unfamiliar, jGoBoard is a library designed to make rendering Go boards (gobans) in your web projects a breeze. It's been around for a while, but using it in modern build processes and ES module based environment was painful, and Grunt used for building has been in maintenance mode for years, not to speak about some of the other parts that were overhauled.
What's New and Exciting?
Switch to Vite in build tools
Can run "npm run dev" if you want hot reloading while tinkering with the code and demos
Outputs ES Modules, CommonJS, and UMD formats, plus better tree-shaking. This translates to smaller file sizes for your projects.
Removing superagent dependency that gets rid of security vulnerabilities in the outdated versions of the past
What's Slightly Less Exciting?
Fix for Github Issue #9: No more illegal move popups when accidentally clicking on coordinate labels outside the board area. The click handler now includes proper bounds checking and coordinate validation.
Improved Demo UX: The "Play demo captures" experience has been refined for a smoother interaction.
Demo Fixes: Even demoTree.html got some attention, with SGF loading fixed (though it's still a work in progress, as noted in the commit!).
And in a nod to the future (and perhaps a theme from some of my recent posts!), you might spot a familiar co-author in the commit history: Claude Code lent a hand in some of the changes, particularly with the version bump and dependency removal. It's always interesting to see how AI can assist in the development workflow!
Get Started
If you're looking to integrate a Go board into your web application, jGoBoard is easier than ever to get started with. Just head to https://jgoboard.com or simply clone the github repo https://github.com/jokkebk/jgoboard and check out the README.md there.
I haven't written much about the new fancy AI tools in the blog, so I thought
I'll do a short writeup on a sample workflow through ChatGPT, VS Code with
GitHub Copilot and Claude Code that resulted in a fully working food diary app
in about one hour from the idea.
The Problem Statement
I decided keeping a food diary would be nice way to avoid unhealthy habits. I
experimented with using ChatGPT's vision capabilities some time ago to do
calorie estimates, and that worked pretty well, so I thought I'd combine a
simple Google Sheet and occasional ChatGPT use for a 95 % working solution
without needing to bother with installing an app that would likely want to
overhaul my whole diet, and subscribe me to a $19.99/mo plan while at it.
However, manually firing up the Google Sheet when on computer (the mobile
version is crummy) wasn't ideal, so enter ChatGPT -- maybe I could do a native
Android client with AI calorie estimates easily? So I asked GPT-5:
I'd like to create a super simple food diary app on my Android phone:
Add a diary entry either by writing what I ate, taking a picture, or both
Gemini API used for a calorie estimate from AI
Diary stored permanently on my server (maybe including the pics?)
Outline for me three different architectures. I have a Raspberry Pi available, and a
cloud server. I'd like minimal backend solution for storage which I can also view
manually (say JSON or SQLite or even Google Sheet). Native app would be fun,
but at least something I can quickly fire up from phone and upload photo.
After a while of thought, GPT5 kindly gave me three ideas, to summarize:
Telegram bot + tiny API on your Pi/cloud (fastest to use from phone)
Google Sheets + Apps Script Web App (no server to run)
Native Android app (Kotlin) + tiny API on Pi/cloud (most control, best UX)
Now the first one was actually pretty smart. I had recently done a Telegram bot
for a IoT project and it was quite easy, and it would readily come with picture
sending and chat capabilities. That would be plenty.
Initial version: The Spec
Continuing with the prompt, I gave a sketch of how the interaction could go:
I think the telegram bot sounds nice. I'd like to be able to group messages within a short period to impact the same entry, so the interaction with bot could be like:
> Had a pasta carbonara for lunch
< That's about 700 calories
> [image]
< Based on your description and photo, that's about 900 calories
***Update 2025: I've had more trouble with this fish binding than it is worth. I've crippled my fish shell irrecoverably a couple times and had numerous issues trying to adapt for bash and zsh. I am keeping this post for reference, but I would strongly advice using a proper agentic tool nowadays with some guardrails. ***
Read on if you want to read about my journey to make fish transform comment lines to runnable commands.
After a bit of AI hiatus, I noticed that llama 3.0 models were released and wanted to try the models. Sure enough, after a week the weights we re available at the official site. However, the Docker image hasn't been used in a while and I wanted to upgrade it without losing the models.
There was almost no information on this available online yet, and even the
ollama docker documentation is quite non-existent — maybe for seasoned
Docker users it is obvious what needs to be done? But not for me, so let's see
if I can manage it.
Upgrading the docker image
First, let's just upgrade the ollama/ollama image:
$ sudo docker pull ollama/ollama
This is nice, but the currently running container is still the old one. Let's stop it:
$ sudo docker stop ollama
Checking the location of the files
I remember I set a custom directory to store the models. Let's check where it is:
As can be seen, the models are stored in /mnt/scratch/docker/volumes/ollama/_data. Let's make a hard-linked copy
of the files into another folder, to make sure we don't lose them:
$ sudo bash$ cd /mnt/scratch$ cp -al docker/volumes/ollama/_data ollama_backup
Now that we have the models backed up, let's remove the old container: