Analyzing 433 MHz Nexa Smart Power Plug Remote Control Signal with Arduino Uno
A friend recently started a project to remotely boot his router (which tends to hang randomly) with Raspberry Pi. Unfortunately, the rpi-rf tool was not quite recognizing the signals. I pitched in to help, and as he did not have access to an oscilloscope, but had an Arduino Uno, I thought maybe I could figure it out with that.
Fast forward a few weeks later, I have been experimenting with four methods analyzing my own Nexa 433 MHz remote controller:
- Arduino Uno
- Soundcard a.k.a. "poor man's oscilloscope"
- Raspberry Pi
- An actual oscilloscope, namely my Picoscope 2208B
Having learned a lot, I thought to document the process for others to learn from, or maybe even hijack to analyze their smart remotes. In this first part, I will cover the process with Arduino Uno, and the following posts will go through the other three methods.
Starting Simple: Arduino and 433 MHz receiver
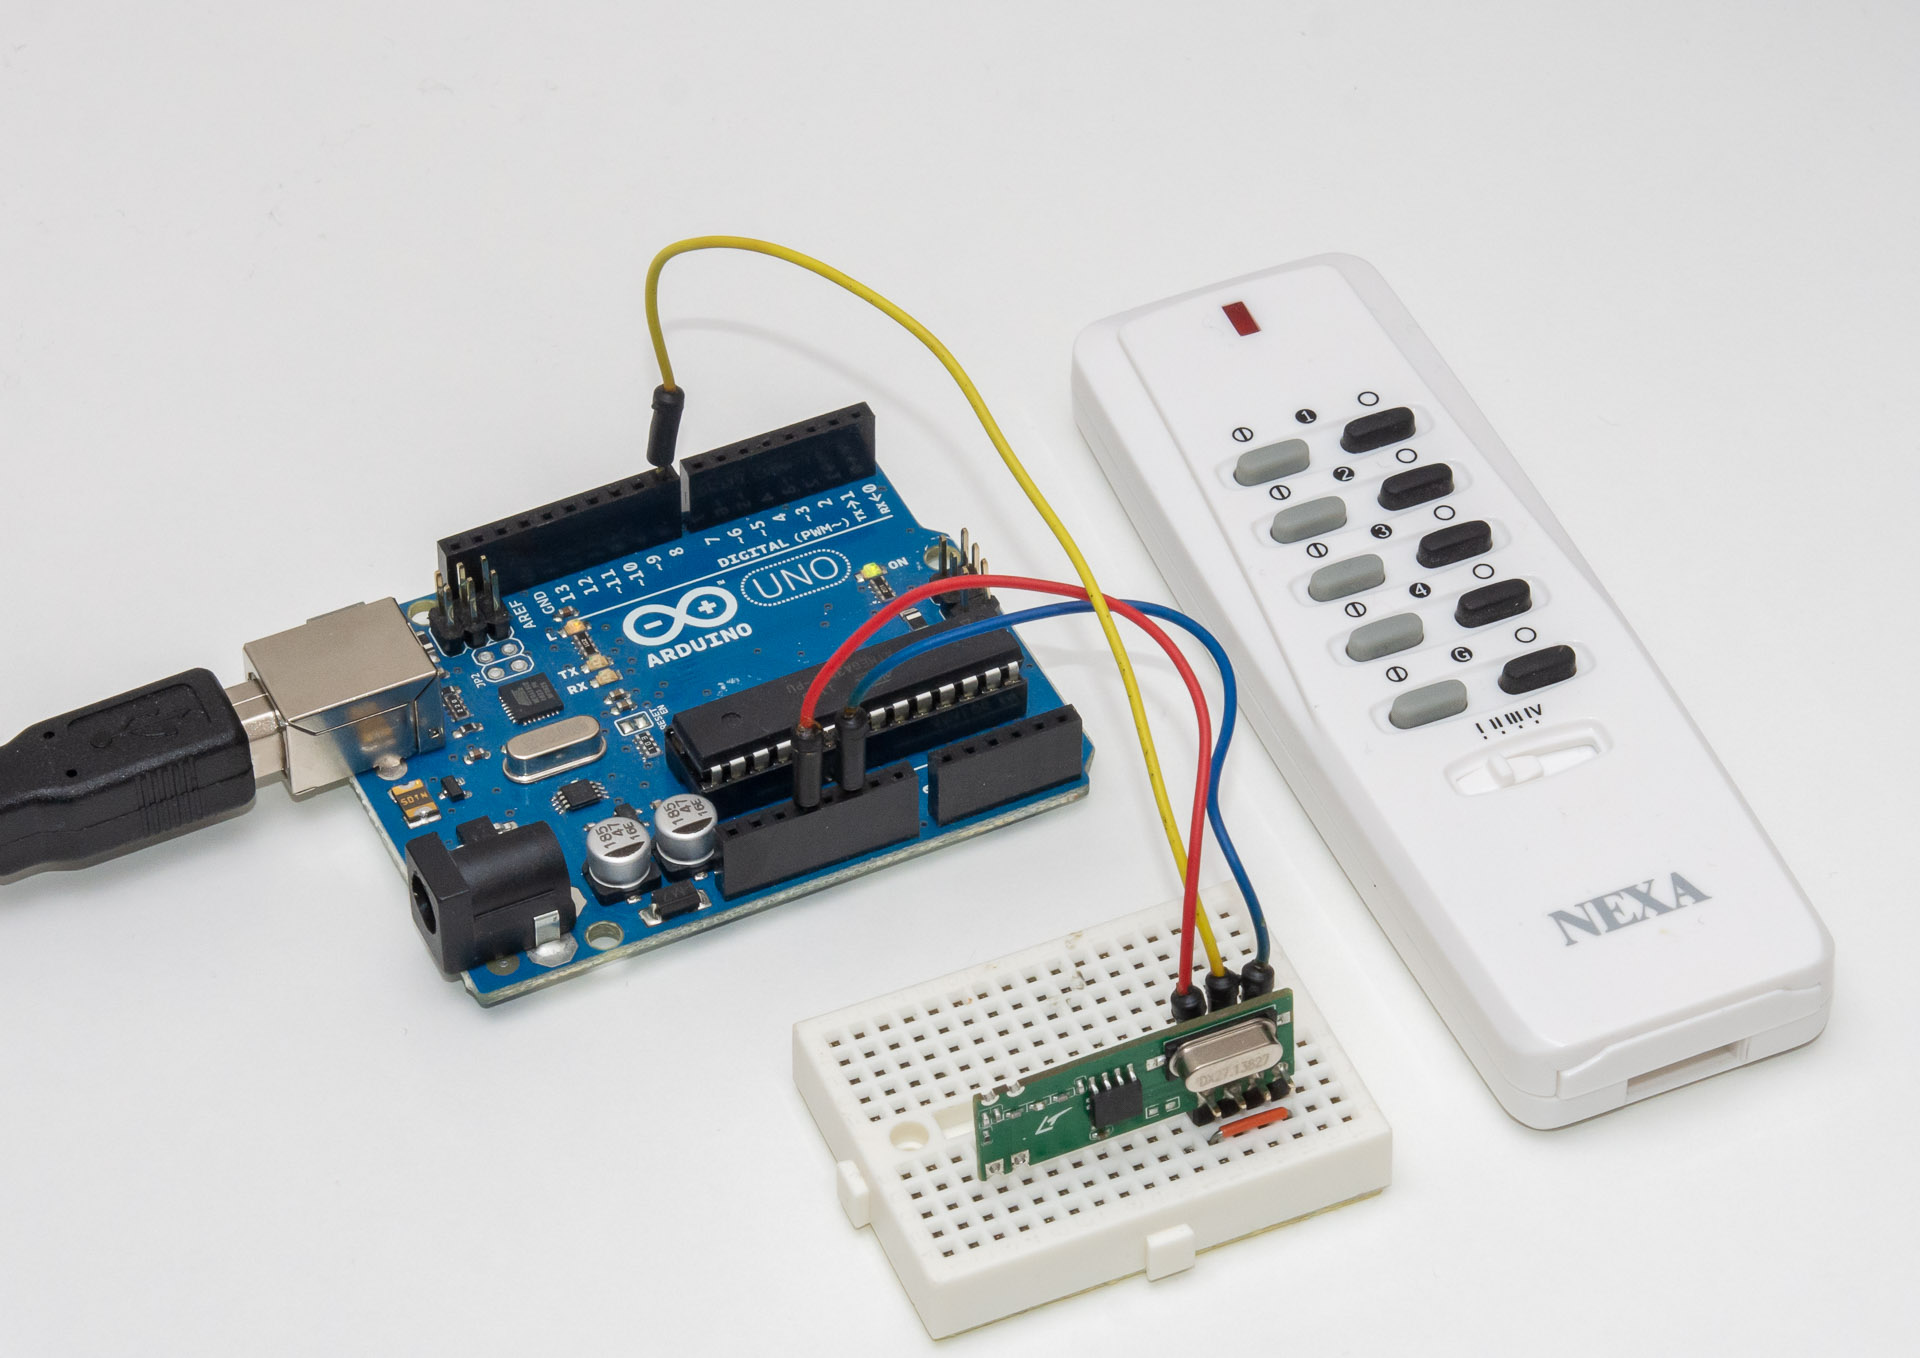
Having purchased a rather basic Hope Microelectronics (RFM210LCF-433D) 3.3V receiver for the 433 MHz spectrum signals, it was easy to wire to Arduino:
- Connect GND and 3.3V outputs from Arduino to GND and VCC
- Connect Arduino PIN 8 to DATA on the receiver
- Connect a fourth "enable" pin to GND as well to turn the receiver on
You can see the setup here (larger version):

I wrote a simple Arduino script that measures the PIN 8 voltage every 50 microseconds (20 kHz), recording the length of HIGH/LOW pulses in a unsigned short array. Due to memory limitation of 2 kB, there is only space for about 850 edges, and the maximum length of a single edge is about 65 000 samples, i.e. bit more than three seconds.
Once the buffer is filled with edge data or maximum "silence" is reached, the code prints out the data over serial, resets the buffer and starts again, blinking a LED for 5 seconds so you know when you should start pressing those remote control buttons. Or perhaps "press a button", as at least my Nexa pretty much fills the buffer with a single key press, as it sends the same data of about 130 edges a minimum of 5 times, taking almost 700 edges!
It also turned out that the "silence" limit is rarely reached, as the Hope receiver is pretty good at catching stray signals from other places when there is nothing transmitting nearby (it likely has automatic sensitivity to "turn up the volume" if it doesn't hear anything).
#define inputPin 8 // Which pin to monitor

void setup() {
  pinMode(LED_BUILTIN, OUTPUT);
  Serial.begin(38400);
}

#define BUFSIZE 850
#define WAIT_US 50 // 20 kHz minus processing overhead

unsigned short buf[BUFSIZE];
short pos = 0;
bool measure = false;

void loop() {
  if(measure) {
    unsigned char data = digitalRead(inputPin) == HIGH ? 1 : 0;
    if(data == (pos&1))
      pos++; // data HIGH and odd pos or LOW and even -> advance

    if(buf[pos] > 65000 || pos >= BUFSIZE) {
      measure = false;
      return; // avoid overflow
    }

    buf[pos]++;
    delayMicroseconds(WAIT_US); // Wait until next signal
  } else { // end measure
    digitalWrite(LED_BUILTIN, LOW); // LED OFF = dumping
    Serial.println();
    Serial.print("N =");
    Serial.println(pos, DEC);
    for(int i=0; i<pos && i<BUFSIZE; i++) {
      Serial.print(buf[i], DEC);
      if(buf[i] > 100000/WAIT_US)
        Serial.println(); // 100 ms delays get a newline
      else
        Serial.print(' ');
      buf[i] = 0; // reset
    }
    pos = 0; // restart
    measure = true;
    for(int i=0; i<10; i++) { // 5s blink before next measurement
      digitalWrite(LED_BUILTIN, (i&1) ? LOW : HIGH);
      delay(500);
    }
    Serial.println("\nGO");
    digitalWrite(LED_BUILTIN, HIGH); // LED ON = measuring
  }
}
Analyzing the data
Here is some sample data from the serial monitor:
N =850
436 2 210 1 371 1 2200
1 382 2 579 1 88 3 532 1 2831
2 1096 1 191 1 301 1 217 1 600 5 6 47 5 5 5 23 5 5 4 24 4 5 5 23 5 23 5 5 4 24 4 6 4 23 5 5 4 24 4 6 4 5 5 24 4 5 5 23 4 6 4 24 4 5 5 23 5 5 4 24 4 5 5 23 5 23 5 5 4 6 4 23 5 5 4 24 5 5 5 23 4 6 4 24 4 5 5 23 5 5 4 24 4 5 5 23 5 23 5 5 5 5 4 24 4 23 5 5 5 23 4 6 4 5 5 24 4 5 4 24 5 23 4 6 4 5 5 23 5 5 4 24 5 4 5 85 1 3 51 2 12 1 2 1 9 1 11 2 21 1 19 2 19 6 5 48 5 4 5 23 5 5 5 23 4 5 5 24 4 23 5 5 4 24 4 6 4 24 4 5 5 23 5 5 4 5 5 24 4 5 5 23 5 5 4 24 4 6 4 23 5 5 4 24 5 5 4 24 4 24 4 5 5 5 4 24 4 6 4 24 4 5 5 23 5 5 4 24 4 6 4 23 5 5 4 24 5 4 5 24 4 23 5 5 5 5 4 24 4 24 4 6 4 23 5 5 5 5 4 24 4 5 5 23 5 23 5 5 5 4 5 24 4 5 5 23 5 5 4 24 4 5 5 23 5 184 4 48 5 5 4 24 4 5 5 23 5 5 4 24 4 24 4 5 5 23 5 5 5 23 4 6 4 24 4 5 5 5 4 24 5 5 4 24 4 5 5 23 5 5 4 24 4 6 4 23 5 5 4 24 5 23 4 6 4 5 5 23 5 5 4 24 5 5 4 24 4 5 5 23 5 5 4 24 4 5 5 23 5 5 5 23 4 24 4 6 4 5 5 23 5 23 5 5 4 24 4 6 4 5 5 23 5 5 4 24 4 24 4 5 5 5 5 23 4 6 4 23 5 5 5 23 5 5 4 23 5 184 4 48 5 5 5 23 5 5 4 24 4 5 5 23 5 23 4 6 4 24 4 5 5 23 5 5 4 24 4 6 4 5 5 24 4 5 4 24 4 6 4 24 4 5 5 23 5 5 4 24 4 5 5 24 4 23 5 5 4 6 4 23 5 5 5 23 5 5 4 24 4 6 4 23 5 5 5 23 5 5 4 24 4 5 5 23 5 23 5 5 4 6 4 23 5 24 4 5 5 23 5 5 4 6 4 24 4 5 5 23 5 23 5 5 4 5 5 23 5 5 5 23 4 6 4 24 4 5 5 23 4 184 5 48 4 5 5 23 5 5 5 23 4 6 4 23 5 23 5 5 4 24 5 5 4 24 4 5 5 23 5 5 4 6 4 24 4 5 5 23 5 5 5 23 4 6 4 24 4 5 5 23 5 5 4 24 4 24 4 5 5 5 5 23 4 6 4 24 4 5 5 23 5 5 5 23 4 6 4 23 5 5 4 24 5 5 4 24 4 24 4 5 5 5 4 24 4 24 4 6 4 23 5 5 5 5 4 24 5 4 5 24 4 23 5 5 5 5 4 24 4 5 5 23 5 5 4 24 4 5 5 23 5 4509
1 40 1 5 3 105 1 7 1 20 3 1 1 5 2 236 1 50 2 187 2 19 1 82 1 52 1 4 2 151 3 29 4 20 2 84 2 15 3 29 2 14 1 28 1 6 2 34 3 9 3 1 5 2 3 8 8 8 3 2 3 1 6 1 1 4 10 4 1 2 2 3 8 17 3 3 9 8 4 5 3 1 11 1 1 1 3 2 11 7 2 5 16 6 10 2 11 1 14 2 14 1 3 1 13 8 5 2 8 1 3 1 3 3 5 2 1 5 11 2 4 2 32 2 10 1 16 1 2 3 9 7 8 1 9 4 10 6 19 3 1 2 2 1 24 4 3 1 8 6 GO
Now this is a bit hard to read, but it helps to note that delays larger than 200 cycles are over 10ms. I made the code to write a newline for 100ms and longer delays (2000+) which helps to break it down a bit.
The 3rd line is actually interesting, as it contains pretty repeating looking timings of 4/5, 23/24 etc. How could we easily visualize it? Well, with a little bit of Python of course!
It's quite easy to make a short script to output an SVG vector file based on this timing data. Just scale it to a nice width and you can view the signal in a browser. Here's the code I wrote:
import sys

if len(sys.argv) < 2:
    print("Usage: python makesvg.py time1 time2 time3 ...")
    exit(1)

times = [int(v) for v in sys.argv[1:]]
w, h, x, y = 1000, 200, 0, 50
scale = w / sum(times)

polyline = [f'0,{100+y}']
for t in times:
    x += t
    polyline.append(f'{int(x*scale)},{100+y}') # forward
    polyline.append(f'{int(x*scale)},{100-y}') # up/down
    y = -y

print("""<?xml version="1.0" encoding="UTF-8"?>
<!DOCTYPE svg PUBLIC "-//W3C//DTD SVG 1.1//EN"
"http://www.w3.org/Graphics/SVG/1.1/DTD/svg11.dtd">

<svg width="%d" height="%d" xmlns="http://www.w3.org/2000/svg">
<polyline points="%s" stroke="black" stroke-width="0.5px" fill="none"/>
</svg>""" % (w, h, ' '.join(polyline)))
Not let's create an SVG from that 3rd line:
$ python makesvg.py 2 1096 1 191 1 301 1 217 1 600 5 6 47 5 5 5 23 5 5 4 24 4 5 5 23 5 23 5 5 4 24 4 6 4 23 5 5 4 24 4 6 4 5 5 24 4 5 5 23 4 6 4 24 4 5 5 23 5 5 4 24 4 5 5 23 5 23 5 5 4 6 4 23 5 5 4 24 5 5 5 23 4 6 4 24 4 5 5 23 5 5 4 24 4 5 5 23 5 23 5 5 5 5 4 24 4 23 5 5 5 23 4 6 4 5 5 24 4 5 4 24 5 23 4 6 4 5 5 23 5 5 4 24 5 4 5 85 1 3 51 2 12 1 2 1 9 1 11 2 21 1 19 2 19 6 5 48 5 4 5 23 5 5 5 23 4 5 5 24 4 23 5 5 4 24 4 6 4 24 4 5 5 23 5 5 4 5 5 24 4 5 5 23 5 5 4 24 4 6 4 23 5 5 4 24 5 5 4 24 4 24 4 5 5 5 4 24 4 6 4 24 4 5 5 23 5 5 4 24 4 6 4 23 5 5 4 24 5 4 5 24 4 23 5 5 5 5 4 24 4 24 4 6 4 23 5 5 5 5 4 24 4 5 5 23 5 23 5 5 5 4 5 24 4 5 5 23 5 5 4 24 4 5 5 23 5 184 4 48 5 5 4 24 4 5 5 23 5 5 4 24 4 24 4 5 5 23 5 5 5 23 4 6 4 24 4 5 5 5 4 24 5 5 4 24 4 5 5 23 5 5 4 24 4 6 4 23 5 5 4 24 5 23 4 6 4 5 5 23 5 5 4 24 5 5 4 24 4 5 5 23 5 5 4 24 4 5 5 23 5 5 5 23 4 24 4 6 4 5 5 23 5 23 5 5 4 24 4 6 4 5 5 23 5 5 4 24 4 24 4 5 5 5 5 23 4 6 4 23 5 5 5 23 5 5 4 23 5 184 4 48 5 5 5 23 5 5 4 24 4 5 5 23 5 23 4 6 4 24 4 5 5 23 5 5 4 24 4 6 4 5 5 24 4 5 4 24 4 6 4 24 4 5 5 23 5 5 4 24 4 5 5 24 4 23 5 5 4 6 4 23 5 5 5 23 5 5 4 24 4 6 4 23 5 5 5 23 5 5 4 24 4 5 5 23 5 23 5 5 4 6 4 23 5 24 4 5 5 23 5 5 4 6 4 24 4 5 5 23 5 23 5 5 4 5 5 23 5 5 5 23 4 6 4 24 4 5 5 23 4 184 5 48 4 5 5 23 5 5 5 23 4 6 4 23 5 23 5 5 4 24 5 5 4 24 4 5 5 23 5 5 4 6 4 24 4 5 5 23 5 5 5 23 4 6 4 24 4 5 5 23 5 5 4 24 4 24 4 5 5 5 5 23 4 6 4 24 4 5 5 23 5 5 5 23 4 6 4 23 5 5 4 24 5 5 4 24 4 24 4 5 5 5 4 24 4 24 4 6 4 23 5 5 5 5 4 24 5 4 5 24 4 23 5 5 5 5 4 24 4 5 5 23 5 5 4 24 4 5 5 23 5 4509 > arduino.svgHere's what came out:

Pretty cool! You should be able to notice a five time repeating signal in the middle much easier. We can delete the 1096 ... 600 portion from the beginning and that last 4509 to get much closer look:

There is actually a glitch between 1st and 2nd repeat, probably another radio transmitting at the same time, or Arduino just missing one edge. Repeating the measurements a few times will help to spot these. If I leave only a single repeat, it is pretty easy to see how the Nexa signal is structured:

There is essentially a "start spike" (preceded by dip of equal length) followed by (47 cycle i.e. 2350 us) delay, and then groups of one (1), two (2) or (3) spikes with small delays between the spikes (5-6 cycles) and a bit longer delays (23-24 cycles) between the groups. The above could be described as:
start 2 2 2 1 2 2 2 3 2 2 2 2 2 1 3 2 2 2 2 2 2 1 3 1 2 3 2 1 3 2 2 2 1
Trying out the different buttons of the Nexa remote, we get different combinations of these spikes. Basically the last numbers change, the beginning is the unique "transmitter code" of the remote (to avoid triggering neigbour's Nexa).
Putting it together
Knowing the cycle length of 50 us and number of cycles the signals have, we can now replicate to some extent the Nexa code:
- Pull signal LOW for ca. 250 us, then pull signal HIGH for 250 us (and back to LOW)
- Wait for ca. 2400 us
- Send groups of 1, 2, or 3 HIGH signals lasting about 250 us and about 250 us between them.
- Wait ca. 1200 us between the signals.
- After transmitting one "sequence", wait 10 ms and repeat for a total of 5 repeats (I found out a longer press results in 5+)
Problem with the Arduino is that the memory is very limited. This hurts the accuracy of timing measurements. Once you know the rough length of the signals, you can work around this by measuring a bunch of signals and calculating the average lengths of cycles.
Also, with a clock rate of 16 Mhz, you start to hit some noticeable delays with the dumb "wait and measure" approach. At 100 kHz (10 us delay between measurements) we only have 160 clock cycles per measurement, which is probably the same scale of time that my code takes to do a single measurement -- in effect resulting in only 50k measurements per second instead of 100k. The 20k I am stating above is likely more like 19.5 which is also the reason I added some additional microseconds to Nexa timings stated above. (helped by the fact that I used other methods later)
However, as I discovered when looking at the signal with an oscilloscope, and comparing an Arduino generated signal, the radio circuit introduces additional delays (it seems to take a bit more to start transmitting than to wait idly), and replicating the Nexa signal more closely is painful trial and error without better measurements.
In the following parts I will look at a couple alternatives to make a more accurate analysis:
- Using a soundcard to "record" the signal at 44.1 kHz (or 48 kHz)
- Using Raspberry Pi GPIO with Python
- Using an actual oscilloscope
Stay tuned!