Using a Soundcard as an Oscilloscope to Decode 433 MHz Smart Power Plug Remote Control Signals
I previously covered how to decode Nexa smart power plug remote control signals using Arduino Uno. The drawback of Arduino was the limited capture time and somewhat inaccurate timing information (when using a delay function instead of an actual hardware interrupt timer).
Another way to look at signals is an oscilloscope, and a soundcard can work as a "poor man's oscilloscope" in a pinch. You wire the signal to left/right channel (you could even wire two signals at the same time) and "measure" by recording the audio. It helps if ground level is shared between the soundcard and the signal source. In this case I achieved it pretty well by plugging the Arduino that still provides 3.3V voltage for the 433 MHz receiver chip to the same USB hub as the soundcard.
Another thing to consider is the signal level. Soundcard expects the voltage to be around 0.5V, whereas our receiver is happily pushing full 3.3V of VCC when the signal is high. This can be fixed with a voltage divider -- I wired the signal via a 4.7 kOhm resistor to the audio plug tip, and a 1 kOhm resistor continues to GND -- effectively dropping the voltage to less than a fifth of original.
The audio plug "sleeve" should be connected to GND as L/R channel voltages are relative to that. There was a 0.1V difference in voltage between soundcard sleeve and Arduino GND so I decided to put a 1 kOhm resistor also here to avoid too much current flowing through a "ground loop".
Note that I'm using a SparkFun breakout for the plug that makes connecting the plug to a breadboard quite easy. If you need to wire it directly to the connector (signal to "tip" and ground to "sleeve"), refer to diagram here: https://en.wikipedia.org/wiki/Phone_connector_(audio). A word of caution: You can break stuff if you wire it incorrectly or provide too high voltage to some parts, so be careful and proceed at your own risk!
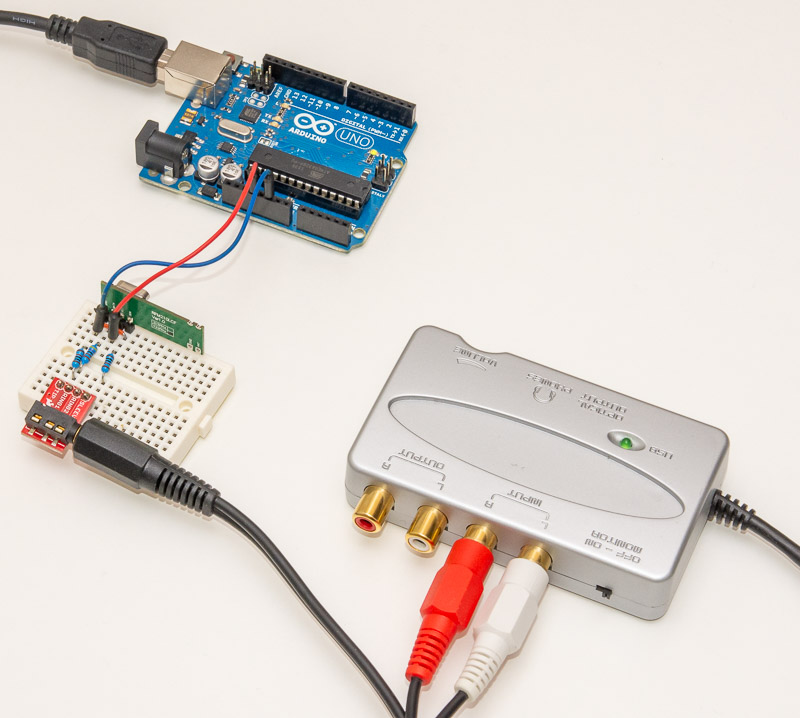
You can see the circuit in the picture above. Note that due to receiver needing GND in two places, I've been able to connect the sleeve to another GND point (rightmost resistor) than the other 1 kOhm resistor that is part of the voltage divider (leftmost resistor)
Trying it out with Audacity
Once you have power to the receiver, and 1 kOhm resistors to sleeve and tip and signal through a 4.7 kOhm (anything between that and 22 kOhm works pretty well with 16 bits for our ON/OFF purposes), you can start a recording software like Audacity to capture some signals. Here is a sample recording where I've pressed the remote a couple of times:
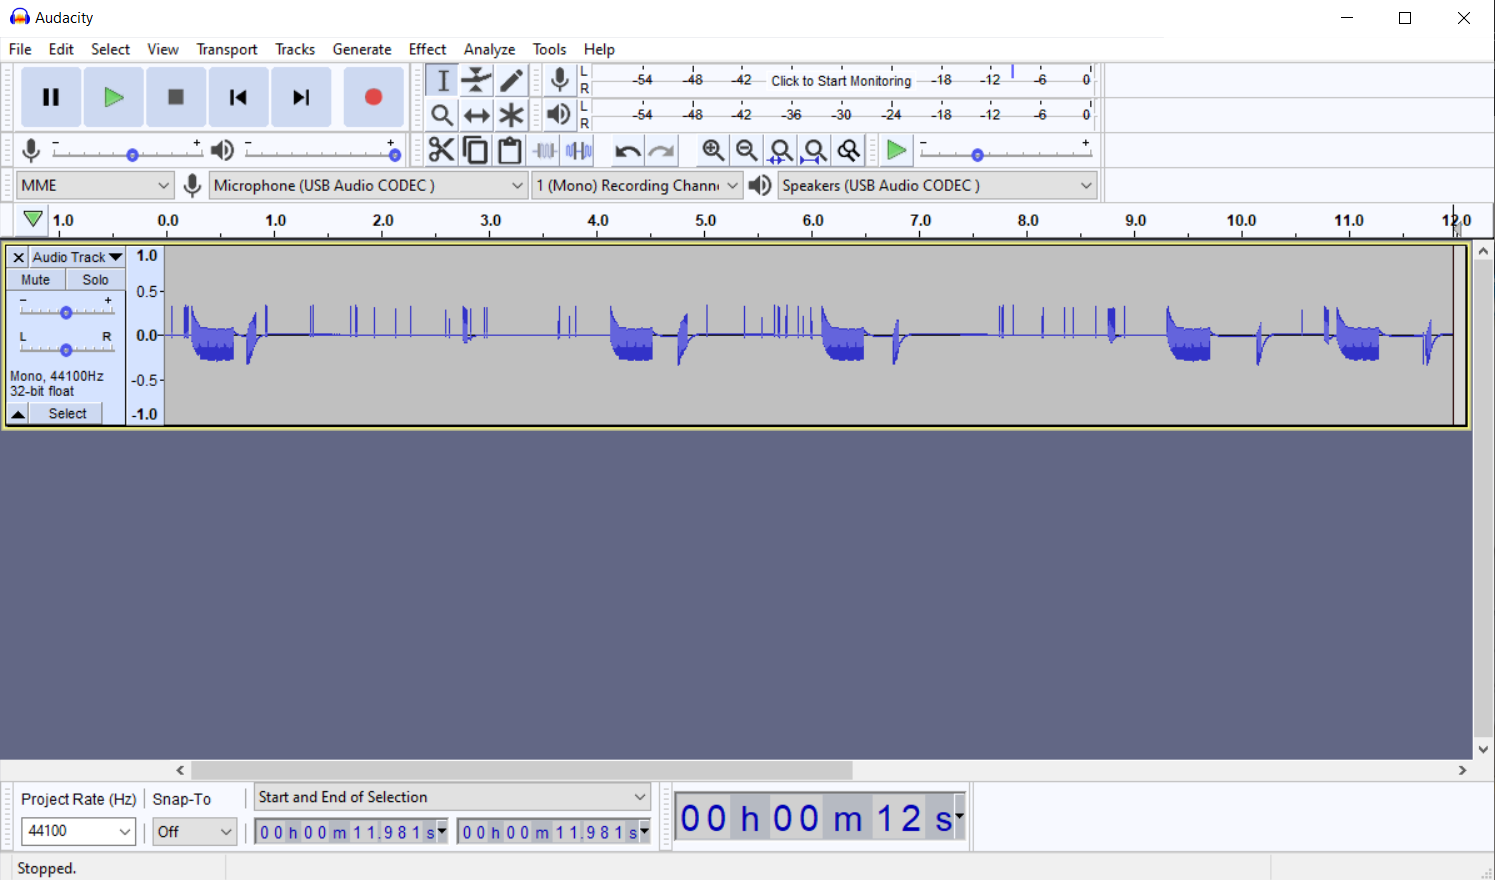
As you can see, our signal is one-sided (audio signals should be oscillating around GND, where as our is between GND and +0.5V) which causes the signal to waver around a bit. If you want a nicer signal you can build a somewhat more elaborate circuit but this should do for our purposes.
By the way, you can use ctrl-A to select all of the recorded audio and use the "Amplify" effect (with default settings) maximize signal to available audio headroom. Makes looking at the signals a little easier. I've done that before the captures below. Another issue becomes apparent when we zoom in a bit closer:
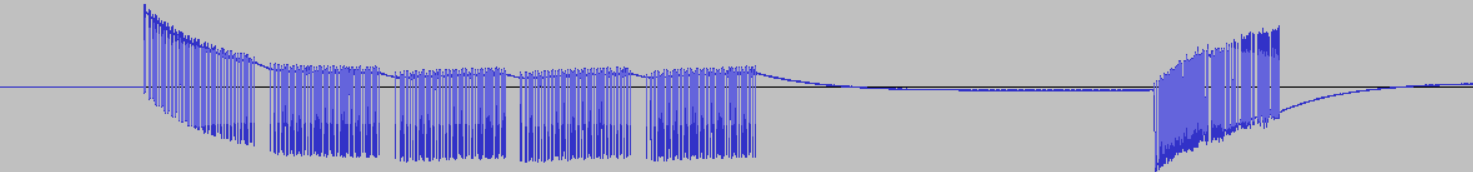
Due to automatic gain in the receiver chip (or maybe some other anomaly), the receiver consistently captures some "garbage signal" some 200 ms after the "official" Nexa signal we got a glimpse of in the [previous part of this series]. It is not pure noise but seems to contain some other signal, probably coming somewhere else in the building but at a much lower power level -- the receiver records this as well, but blocks it for a while once it gets the more powerful Nexa signal.
To analyze the Nexa signal, I suggest deleting other parts of audio capture than the actual signals. I actually tore open the Nexa remote and measured the signal straight from the antenna to make sure this recurring "tail" is not coming from the remote. :D
Below you can see a zoom-in of the signal at various levels of magnification. Note that I'm not zooming in on the first signal that has the "spike" before the actual signal starts.


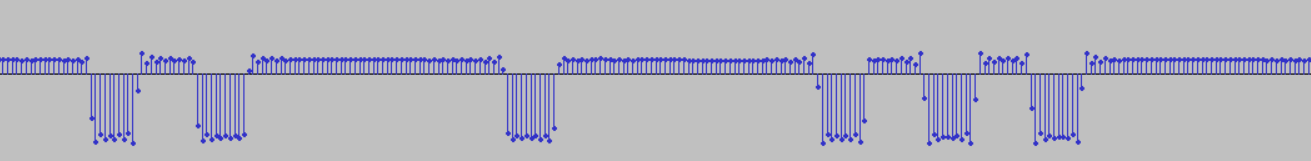
As you can see, the 44.1 kHz signal has enough resolution to deduce the signal protocol just with Audacity. But countint the individual samples from HIGH and LOW segments to get an average length is pretty tedious. If only we could do it programmatically...
Using Python to analyze the recorded signal
I made a handy Python script to analyze the recorded signal. Basic procedure is:
- Read a 16 bit signed integer WAV file (Audacity calls this 'Signed 16-bit PCM') with
wavelibrary and convert it tolistof integers (representing audio signal volume in each time point). - Detect edges on the signal. Default checks 4 samples apart if the signal is going 30 % up or down. Integer list becomes a list of letters like "----UUU--DD--------UU--".
- Convert the list using run-length encoding to "20 samples up", "41 samples down" type of markings.
- Use
sklearn.clusterto runKMeansalgorithm on the high and low signal lengths, basically grouping the edge lenghts into groups of similar sizes. For example, if you sort HIGH edge lengths and get[19,20,20,20,21,22,124,125,126,126,126,1500,1504,1505]you can pretty easily see that there are three groups of similar lengths (around 20, 126 and 1503 samples long respectively). - Assign letters for each group and print out the signal using this.
Let's take a look at the code. You can find it all from analyze.py
def read(filename, treshold=30, width=4):
    w = wave.open(filename)
    hz = w.getframerate()
    fps = w.getnframes()
    chans = w.getnchannels()
    b = w.readframes(fps)
    print(f'Opened {filename}, {w.getnchannels()} channels, {hz} Hz {w.getsampwidth()*8} bits {w.getcompname()}')

    print(f'Unpacking {fps} bytes in {len(b)} buffer')
    # Use struct to convert b to words
    words = unpack(f'{fps*chans}h', b)
    minw, maxw = min(words), max(words)
    print(f'{fps} samples from {minw} to {maxw}')
    print(f'{1e6/hz:.2f} us per sample')

    scaled = [(val - minw) / (maxw - minw) for val in words]

    # Edge detection to vals
    vals = []
    for i in range(fps-width):
        diff = scaled[i+width] - scaled[i]
        if diff > treshold/100: vals.append('U')
        elif diff < -treshold/100: vals.append('D')
        else: vals.append('-')

    return list(rle(vals, scale = 1e6/hz))
The read() function opens the wave file, gets recording frequency, length, etc. and uses struct.unpack to convert it to words (16 bit integers). By the way, much of this code was written with help of ChatGPT, as I had not loaded WAV files with Python previously!
Once the data is read, it scales the values to be between 0 and 1.0 (floats) for edge detection. The edge detection just looks at the values that are width samples apart and sees if signal seems to be going up (U) or down (D). Then it calls rle() method to convert this list into tuples of (type, length):
def rle(vals, scale=1.0):
    # Find the first down and up edges
    dp, up = vals.index('D'), vals.index('U')
    if dp == -1 or up == -1:
        print('Not enough edges found. You might want to increase the threshold')
        exit(0)

    now, seek = 'U', 'D'
    # Swap now and seek if up < dp
    if up < dp: now, seek = seek, now

    pos = 0
    while pos < len(vals):
        try: nextPos = vals.index(seek, pos)
        except ValueError: nextPos = len(vals)
        yield (now, scale * (nextPos - pos))
        pos = nextPos
        now, seek = seek, now # swap
You can use the analyze.py as a library. Note that you need a couple of libraries like sklearn and numpy installed on your Python environment. I'll leave the installation as an exercise for the reader. Running python in the same directory as analyze.py and samples Audacity.wav will let you do this:
$ python
Python 3.10.7 (tags/v3.10.7:6cc6b13, Sep  5 2022, 14:08:36) [MSC v.1933 64 bit (AMD64)] on win32
Type "help", "copyright", "credits" or "license" for more information.
>>> from analyze import read
>>> data = read('Audacity.wav')
Opened Audacity.wav, 1 channels, 44100 Hz 16 bits not compressed
Unpacking 18177 bytes in 36354 buffer
18177 samples from -27634 to 30684
22.68 us per sample
>>> data
[('D', 14920.63492063492), ('U', 294.7845804988662), ('D', 249.4331065759637), ('U', 2630.3854875283446), ('D', 249.4331065759637), ('U', 249.4331065759637), ('D', 249.4331065759637), ('U', 1292.517006802721), ('D', 249.4331065759637), ('U', 272.10884353741494), ('D', 249.4331065759637), ('U', 1292.517006802721), ('D', 226.75736961451247), ('U', 294.7845804988662), ('D', 226.75736961451247), ('U', 1269.8412698412699), ('D', 249.4331065759637), ...
All right! This looks pretty nice. Using the code we can do the clustering part, letting user to choose the best amount of clusters (did not want to automate this):
if __name__ == '__main__':
    parser = argparse.ArgumentParser(description='Record button presses')
    parser.add_argument('filename', type=str, help='File to process')
    parser.add_argument('--treshold', type=int, help='Percentage of level change to be considered an edge, e.g. 30', default=30)
    parser.add_argument('--width', type=int, help='Edge detection width in samples, e.g. 4', default=4)
    parser.add_argument('--limit', type=float, help='Sample limit for clustering in ms, default 25.0', default=25.0)
    args = parser.parse_args()

    tuples = read(args.filename, args.treshold, args.width)

    centers = {}
    for typ in 'UD':
        arr = np.array([v for t,v in tuples if t==typ and v<args.limit*1e3]).reshape(-1,1)
        #print(arr)
        clusterings = []
        for n in range(1,8):
            kmeans = KMeans(n_clusters=n, n_init="auto").fit(arr)
            print(f'{n} clusters has {kmeans.inertia_} inertia:')
            c = Counter(kmeans.labels_)
            clusters = []
            for k in range(n):
                vals = sorted({arr[i,0] for i,v in enumerate(kmeans.labels_) if v==k})
                clusters.append((kmeans.cluster_centers_[k,0], c[k], vals[0], vals[-1]))
            clusterings.append(sorted(clusters))
            for center,num,vmin,vmax in clusterings[-1]:
                print(f'{num:>5} * {center:<5.2f} ({vmin:.0f} - {vmax:.0f} us)')
            if kmeans.inertia_ < 1: break
        n = int(input('Select number of clusters: '))-1
        centers[typ] = [v[0] for v in clusterings[n]]

    markers = {
        'U': ['.', '_', ' wait ', '\nlong wait ', '\nvery long wait '],
        'D': list('abcdefg')
    }
    for t in 'UD':
        for m, c in zip(markers[t], centers[t]):
            print(f'{m} is {c:.0f} us')

    for t,v in tuples:
        if v > args.limit*1e3: print(f'\n{v} samples {t}')
        else:
            dists = [(abs(center-v), i) for i,center in enumerate(centers[t])]
            nearest = min(dists)[1]
            print(markers[t][nearest], end='')
As you can see, I've used the argparse package to let user specify some command line arguments to change the edge detection treshold and window width, as well as put an upper limit for clustering (useful when analyzing a longer capture with multiple repeats of the signal). Using the code is pretty easy:
$ python analyze.py Audacity.wav
Opened Audacity.wav, 1 channels, 44100 Hz 16 bits not compressed
Unpacking 18177 bytes in 36354 buffer
18177 samples from -27634 to 30684
22.68 us per sample
1 clusters has 591074917.7946086 inertia:
  331 * 959.71 (249 - 13583 us)
2 clusters has 106895808.23310035 inertia:
  326 * 809.93 (249 - 2630 us)
    5 * 10725.62 (10000 - 13583 us)
3 clusters has 19031501.40337947 inertia:
  161 * 284.36 (249 - 317 us)
  165 * 1322.75 (1247 - 2630 us)
    5 * 10725.62 (10000 - 13583 us)
4 clusters has 8827419.770726401 inertia:
  161 * 284.36 (249 - 317 us)
  165 * 1322.75 (1247 - 2630 us)
    4 * 10011.34 (10000 - 10023 us)
    1 * 13582.77 (13583 - 13583 us)
5 clusters has 71761.54875784848 inertia:
  161 * 284.36 (249 - 317 us)
  160 * 1282.03 (1247 - 1315 us)
    5 * 2625.85 (2608 - 2630 us)
    4 * 10011.34 (10000 - 10023 us)
    1 * 13582.77 (13583 - 13583 us)
6 clusters has 42111.79405815821 inertia:
   72 * 269.27 (249 - 272 us)
   89 * 296.57 (295 - 317 us)
  160 * 1282.03 (1247 - 1315 us)
    5 * 2625.85 (2608 - 2630 us)
    4 * 10011.34 (10000 - 10023 us)
    1 * 13582.77 (13583 - 13583 us)
    ...
Select number of clusters: 5
1 clusters has 214884039.2628542 inertia:
  331 * 285.26 (227 - 14921 us)
2 clusters has 40829.72660880011 inertia:
  330 * 240.91 (227 - 272 us)
    1 * 14920.63 (14921 - 14921 us)
3 clusters has 511.68080749251106 inertia:
  125 * 226.76 (227 - 227 us)
  205 * 249.54 (249 - 272 us)
    1 * 14920.63 (14921 - 14921 us)
4 clusters has 2.2467263451673758e-24 inertia:
  125 * 226.76 (227 - 227 us)
  204 * 249.43 (249 - 249 us)
    1 * 272.11 (272 - 272 us)
    1 * 14920.63 (14921 - 14921 us)
Select number of clusters: 2
. is 284 us
_ is 1282 us
 wait  is 2626 us

long wait  is 10011 us

very long wait  is 13583 us
a is 241 us
b is 14921 us
b.a wait a.a_a.a_a.a_a_a.a_a.a_a.a_a.a.a_a.a_a.a_a.a_a.a_a.a_a_a.a.a_a.a_a.a_a.a_a.a_a.a_a.a_a_a.a.a_a_a.a_a.a.a_a.a_a_a.a.a_a.a_a.a_a.a_a
long wait a wait a.a_a.a_a.a_a_a.a_a.a_a.a_a.a.a_a.a_a.a_a.a_a.a_a.a_a_a.a.a_a.a_a.a_a.a_a.a_a.a_a.a_a_a.a.a_a_a.a_a.a.a_a.a_a_a.a.a_a.a_a.a_a.a_a
long wait a wait a.a_a.a_a.a_a_a.a_a.a_a.a_a.a.a_a.a_a.a_a.a_a.a_a.a_a_a.a.a_a.a_a.a_a.a_a.a_a.a_a.a_a_a.a.a_a_a.a_a.a.a_a.a_a_a.a.a_a.a_a.a_a.a_a
long wait a wait a.a_a.a_a.a_a_a.a_a.a_a.a_a.a.a_a.a_a.a_a.a_a.a_a.a_a_a.a.a_a.a_a.a_a.a_a.a_a.a_a.a_a_a.a.a_a_a.a_a.a.a_a.a_a_a.a.a_a.a_a.a_a.a_a
long wait a wait a.a_a.a_a.a_a_a.a_a.a_a.a_a.a.a_a.a_a.a_a.a_a.a_a.a_a_a.a.a_a.a_a.a_a.a_a.a_a.a_a.a_a_a.a.a_a_a.a_a.a.a_a.a_a_a.a.a_a.a_a.a_a.a_a
very long wait
The program clusters HIGH and LOW edges separately. I chose 5 for the first as 6 clusters splits shortest edge of around 284 us to "short" 270 us and "long" 297 us versions, which seemed to be more of an artifact than actual feature of the Nexa signal (might be wrong of course, but it did work with single value). For HIGH signals, there is only two clusters: the 240 us spike and a rather long wait before the actual signal.
The program outputs then the average waits of different "characters" of the signal, followed by the corresponding character representation. So "a.a" for example means "241 us HIGH, 284 us LOW, 241 us HIGH". We can see the one, two and three "prong" spikes of the audio signal being represented by "a", "a.a" and "a.a.a" respectively, separated by slightle longer LOW signals (_). Pretty neat!
You can do manual conversion to the previous article's 1-2-3 format by pasting the signal to notepad and doing a bit of replacement:
- Replace 'a.a.a' with '3'
- Replace 'a.a' with '2'
- Replace 'a' with '1'
Adding a bit of whitespace shows the repeat nicely (as you can see, "wait" became "wa1t", I left that there for some added humour):
        b.1 w1it 2_2_2_1_2_2_2_3_2_2_2_2_2_1_3_2_2_2_2_2_2_1_3_1_2_3_2_1_3_2_2_2_1
long w1it 1 w1it 2_2_2_1_2_2_2_3_2_2_2_2_2_1_3_2_2_2_2_2_2_1_3_1_2_3_2_1_3_2_2_2_1
long w1it 1 w1it 2_2_2_1_2_2_2_3_2_2_2_2_2_1_3_2_2_2_2_2_2_1_3_1_2_3_2_1_3_2_2_2_1
long w1it 1 w1it 2_2_2_1_2_2_2_3_2_2_2_2_2_1_3_2_2_2_2_2_2_1_3_1_2_3_2_1_3_2_2_2_1
long w1it 1 w1it 2_2_2_1_2_2_2_3_2_2_2_2_2_1_3_2_2_2_2_2_2_1_3_1_2_3_2_1_3_2_2_2_1
very long w1it
Conclusion
Cool! With just 3 resistors and an audio cable we were able to record arbitrarily long signals and zoom into them with Audacity. Also, a bit of Python code let us determine the avarage charateristics as well as content of the Nexa signals. Definitely an improvement over the Arduino Uno method!
Stay tuned for next chapter: Using Raspberry Pi!